Ask any apparel factory owner what their biggest costing risk is, and you will hear about fabric prices, currency movement, freight, and labour wages. You will almost never hear about SMV accuracy.
Yet SMV accuracy quietly determines whether your costing is right or wrong on every single garment you make. A 10% SMV error doesn't sound dramatic. It sounds like the kind of imprecision factories live with comfortably. The number gets quoted, the order gets signed, the factory ships, the buyer pays.
Then, six months later, the management accountant looks at the year-end P&L and asks why the margin came in 2.5 points lower than the cost sheets predicted. Nobody connects it back to SMV. Nobody ever does.
In our 40+ years across apparel factories in India, Bangladesh, and Sri Lanka, this is the most consistent — and most invisible — source of margin erosion we see. This article puts a number on it.
Why 10% Is the Right Benchmark
Industry studies consistently show that traditional spreadsheet-based SMV management drifts at 8–15% from true standard times over a typical season. We have chosen 10% as a conservative midpoint for the calculations below — not because it is precise, but because almost no factory we audit comes in under it.
If your factory has not done a structured SMV audit in the last 12 months, the safe assumption is that you are in this 8–15% band — whether you feel it or not.
The Math: What 10% Actually Costs
Consider a mid-sized export factory with the following typical profile:
| Factory Parameter | Value | Source |
|---|---|---|
| Annual revenue (FOB) | USD 30,000,000 | Mid-sized exporter benchmark |
| Direct labour as % of FOB | 18% | Industry average for woven exports |
| Annual direct labour cost | USD 5,400,000 | Calculated |
| SMV error (conservative) | 10% | Methods audit benchmark |
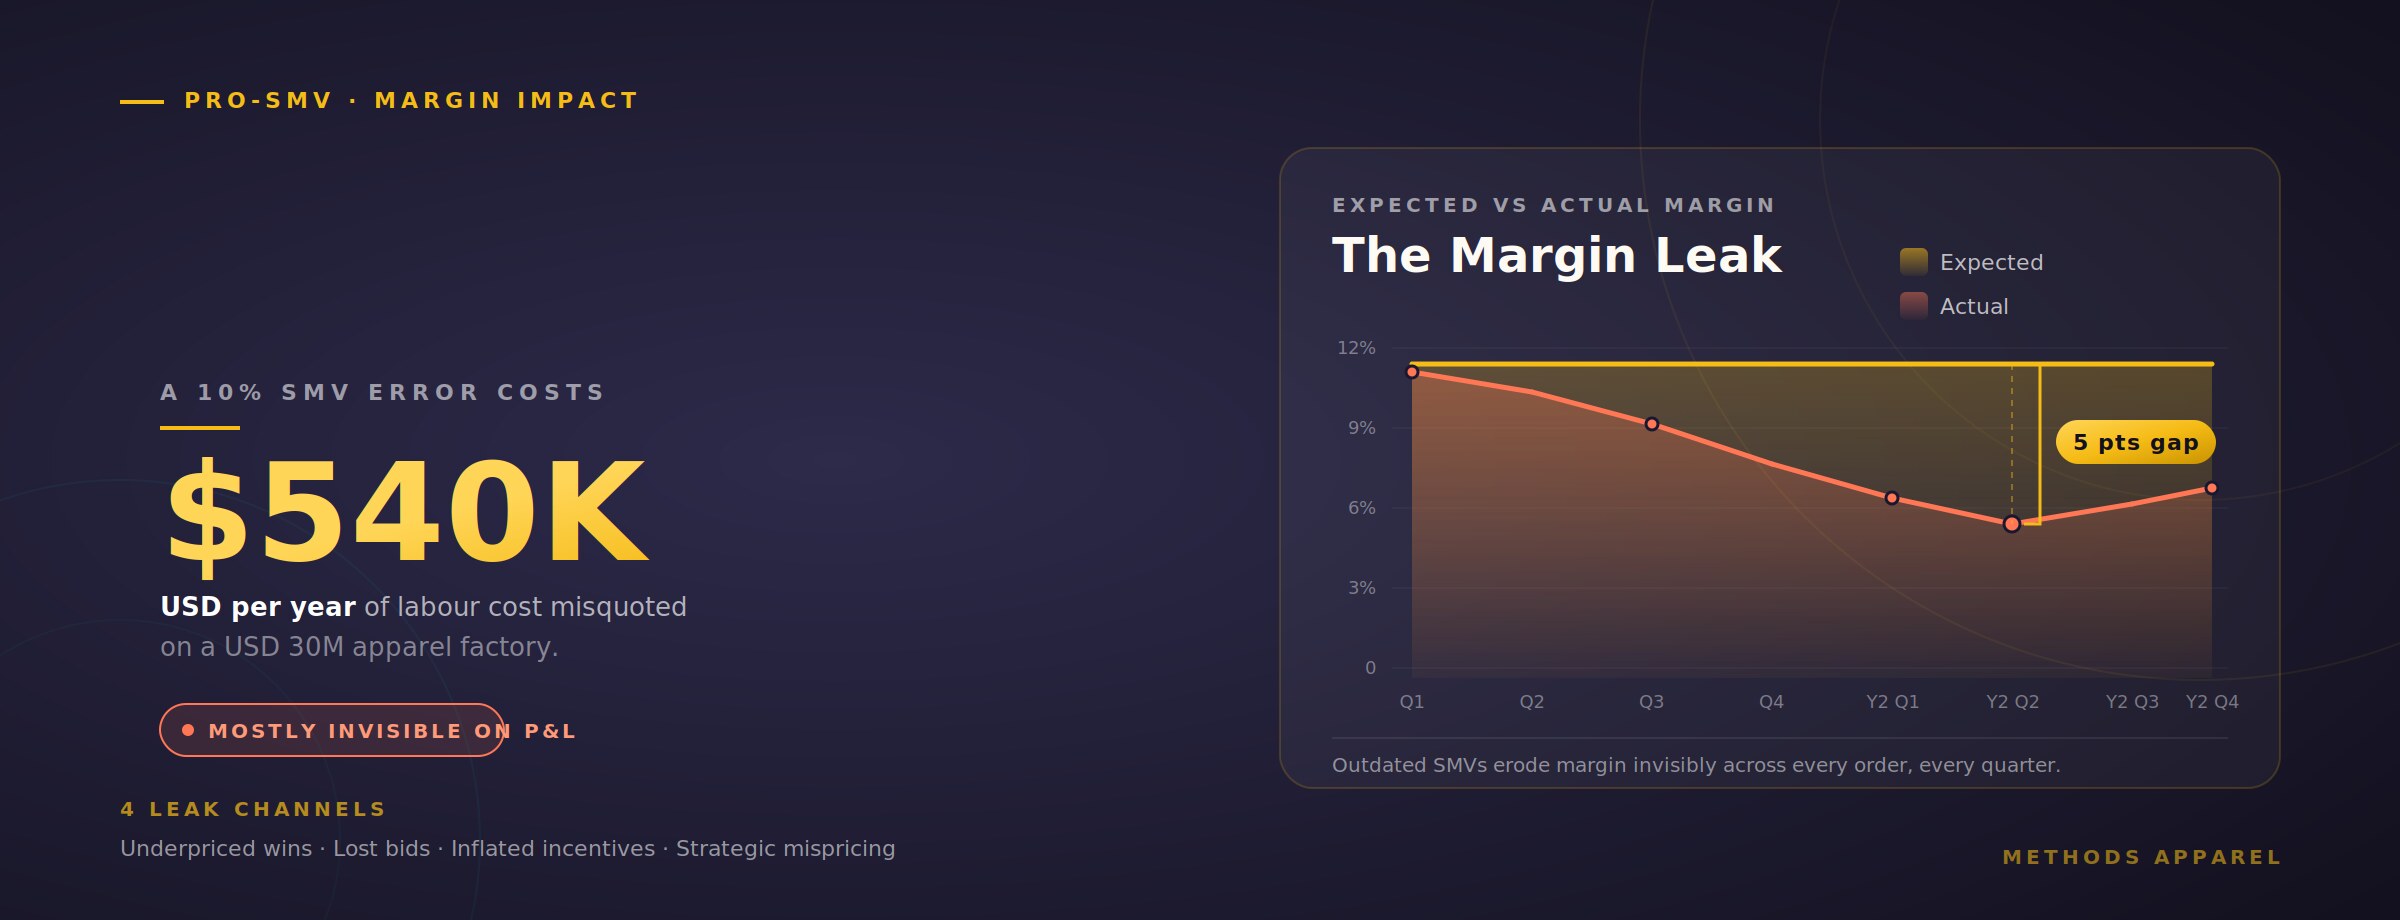
| Labour cost misquoted annually | USD 540,000 | 10% of labour cost |
The labour cost is the easy part to calculate. The harder part — and the part most factory owners miss — is what happens to that USD 540,000 of misquoted cost.
A 10% SMV error doesn't disappear into the ether. It re-distributes itself — some orders are overpriced and lost to competitors, some are underpriced and won at a loss, and the rest erode margin invisibly. The total annual impact is rarely below USD 200,000 on a USD 30M factory.
The Four Channels Through Which the Cost Leaks Out
SMV error doesn't translate to a single line on the P&L. It leaks out through four distinct channels, each of which is hard to see in isolation.
1. Orders Won at a Loss (Underpricing)
When your SMV is too low compared to actual standard time, your cost sheet underestimates labour. You bid lower than you should. The order is "won" — but at a margin that is structurally below target. Across a season, perhaps 15–25% of orders fall into this category. For each, the labour cost was understated by 10%, which on a 12% target margin translates to roughly 1.8 percentage points of margin lost per garment.
2. Orders Lost to Competitors (Overpricing)
The reverse problem is equally costly, and far more invisible. When your SMV is too high, your cost sheet overstates labour. You bid above what a more accurate factory would bid. The order goes to a competitor. You never see it on your P&L because it never landed — but you also never see the contribution margin you would have earned.
A factory operating at 60% capacity utilisation that loses just 5 orders per year at USD 200K each to SMV-driven overpricing has lost USD 1M in potential revenue and ~USD 150,000 in contribution margin.
3. Operator Incentive Distortion
Incentive schemes pay operators when efficiency exceeds 100% against SMV. If the SMV is too loose (set 10% higher than true standard time), operators routinely hit 110-120% efficiency without working any harder. The factory pays incentive on inflated performance.
For a 1,000-machine factory running 26 days a month with an average operator wage of INR 600 per day and an incentive scheme paying 20% of base wage on hitting 120%, the annual incentive leak from loose SMVs alone is INR 25–40 lakhs (USD 30K-48K). This shows up in the wage P&L but is never attributed to SMV.
4. Strategic Mispricing on New Buyers
The most damaging cost is the hardest to quantify. When a sourcing executive from a new buyer asks for your CMT (cut-make-trim) price on a sample garment, you have one chance to quote. Quote too high and you lose the relationship before it starts. Quote too low and you commit to a price that loses money for the next three years of orders.
Factories with accurate, current SMV libraries quote with confidence — and they win the right business at the right price. Factories without them quote with hedged margins (which makes them uncompetitive) or with optimistic numbers (which makes them unprofitable). There is no third option.
The biggest cost of outdated SMVs is not the money you lose — it's the orders, buyers, and growth opportunities you never know you missed. That cost compounds for years.
Putting It All Together: The Real Annual Cost
| Cost Channel | Annual Impact (USD) | Visibility on P&L |
|---|---|---|
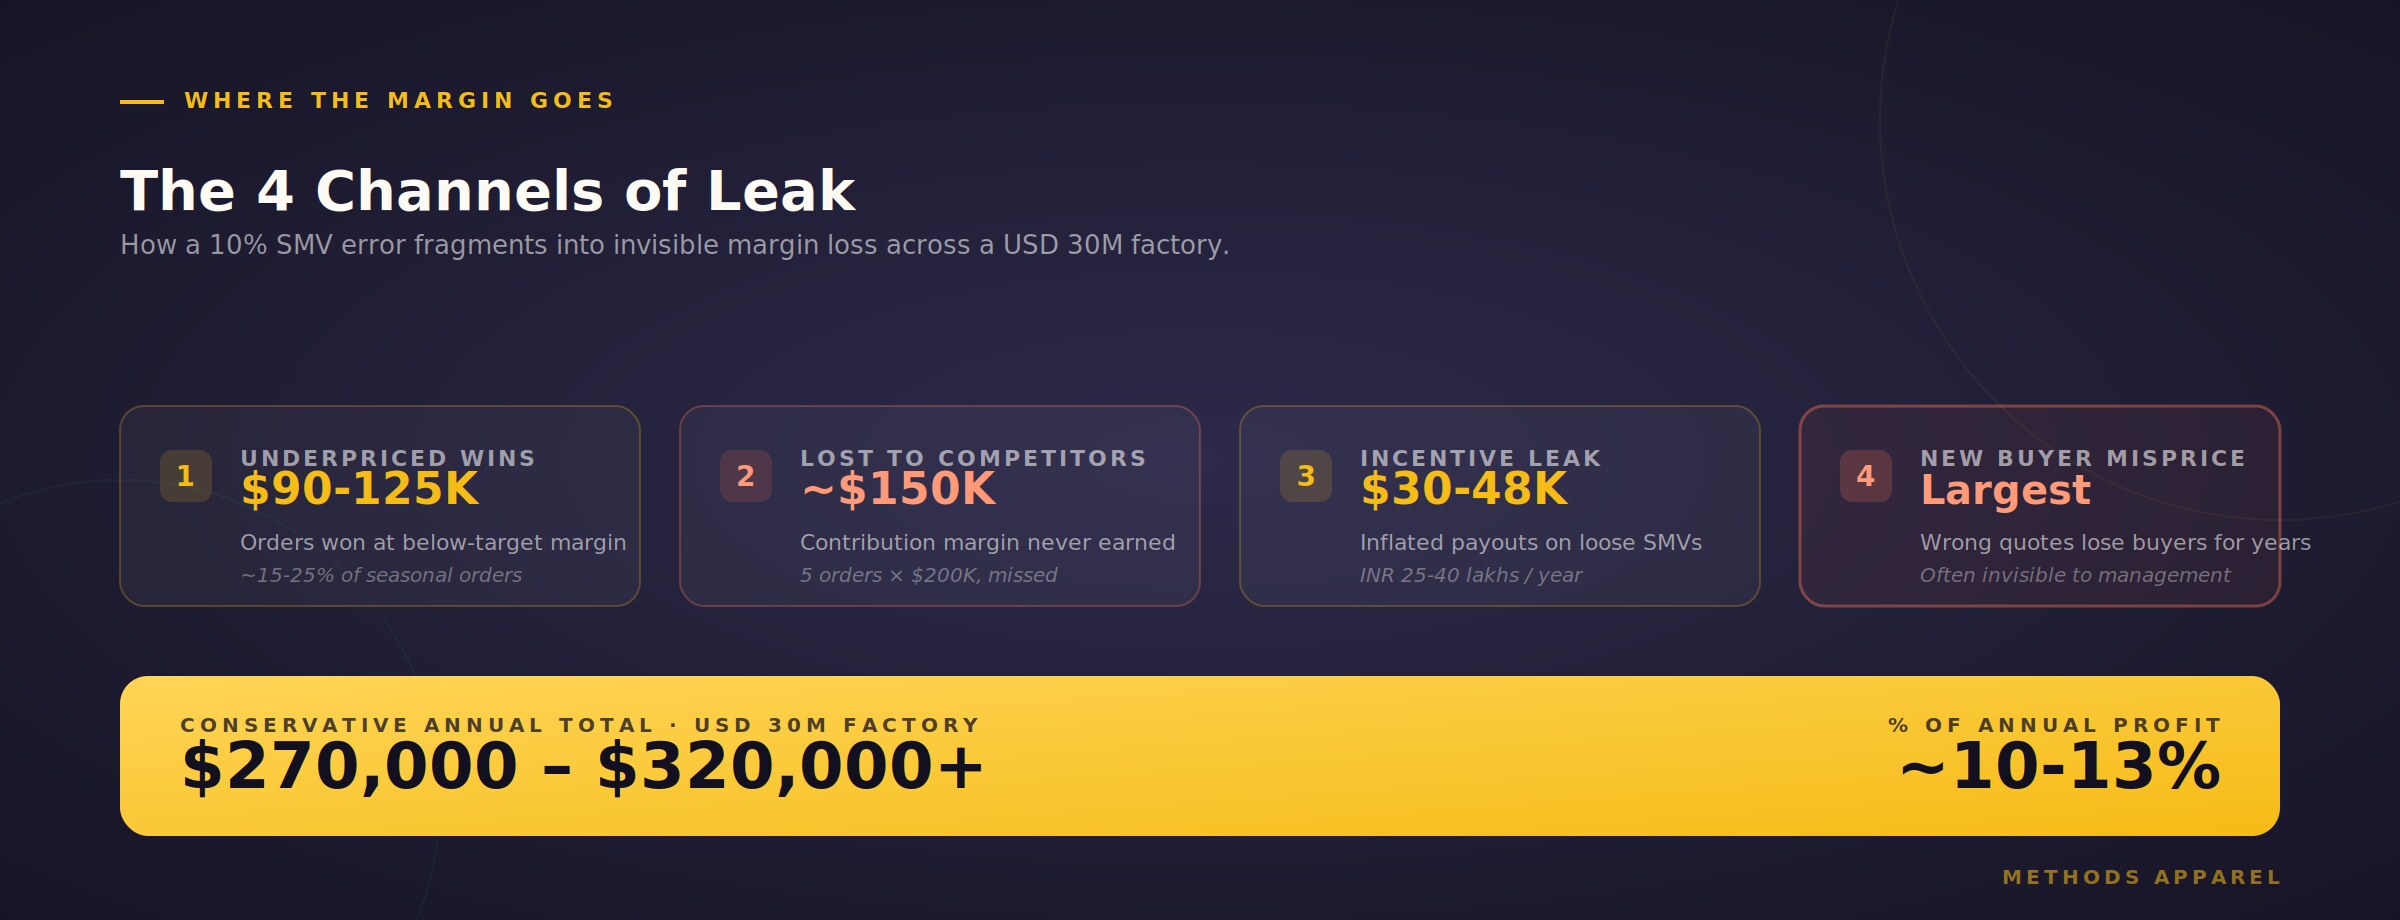
| Orders won at a loss | 90,000 – 125,000 | Hidden in margin variance |
| Orders lost to competitors | ~150,000 (contribution) | Never appears |
| Operator incentive distortion | 30,000 – 48,000 | Shows in wage cost, not attributed |
| Strategic mispricing on new buyers | Difficult to quantify, often largest | Never appears |
| Conservative annual total | USD 270,000 – 320,000+ | Mostly invisible |
For a USD 30M factory operating at typical industry margins of 8–12%, that is roughly 10–13% of annual profit being silently destroyed by SMV imprecision.
Scale this up: a USD 100M factory carries a USD 900K–1M annual hidden cost. A USD 250M group carries USD 2.3–2.5M. These are not edge cases — these are the typical numbers our consulting team finds when we audit factories that have been running on spreadsheet SMVs for years.
Why This Cost Stays Hidden
If the cost is this large, why don't more factories see it? Three reasons:
Each of these makes the SMV cost feel like "noise" rather than a structural problem. Once you start measuring SMV drift directly — and tying it back to specific cost outcomes — the noise resolves into signal.
What Closing the Gap Looks Like
A factory that moves from ~10% SMV error down to ~3% SMV error (which is realistic with a managed SMV system) typically recovers 60–70% of the hidden cost within the first 12 months.
On a USD 30M factory, that is USD 160,000–225,000 of recovered margin in year one — and the recovery compounds in years two and three as the SMV library becomes more accurate, the pricing becomes more confident, and the strategic mispricing on new buyers stops happening.
The investment required to close this gap is a fraction of the annual leak. Most factories see full payback in 4–8 months and pure recovered margin from there onwards.
How Pro-SMV Closes the Gap
Pro-SMV, our flagship standard time management software, is built specifically to address the four cost channels above. It maintains a versioned SMV library that stays current across styles; it enforces consistent rating and allowance discipline across all IEs; it flags drifting operations automatically for re-study; and it gives merchants and costing teams a defensible, audit-traced standard time for every operation in your factory.
But Pro-SMV is only one part of the picture. The real shift is in how a factory thinks about SMV — from a number set once and forgotten, to a managed, measurable input into every costing decision. That mindset shift, combined with the right tooling, is what separates factories that compete on price from factories that compete on profitability.