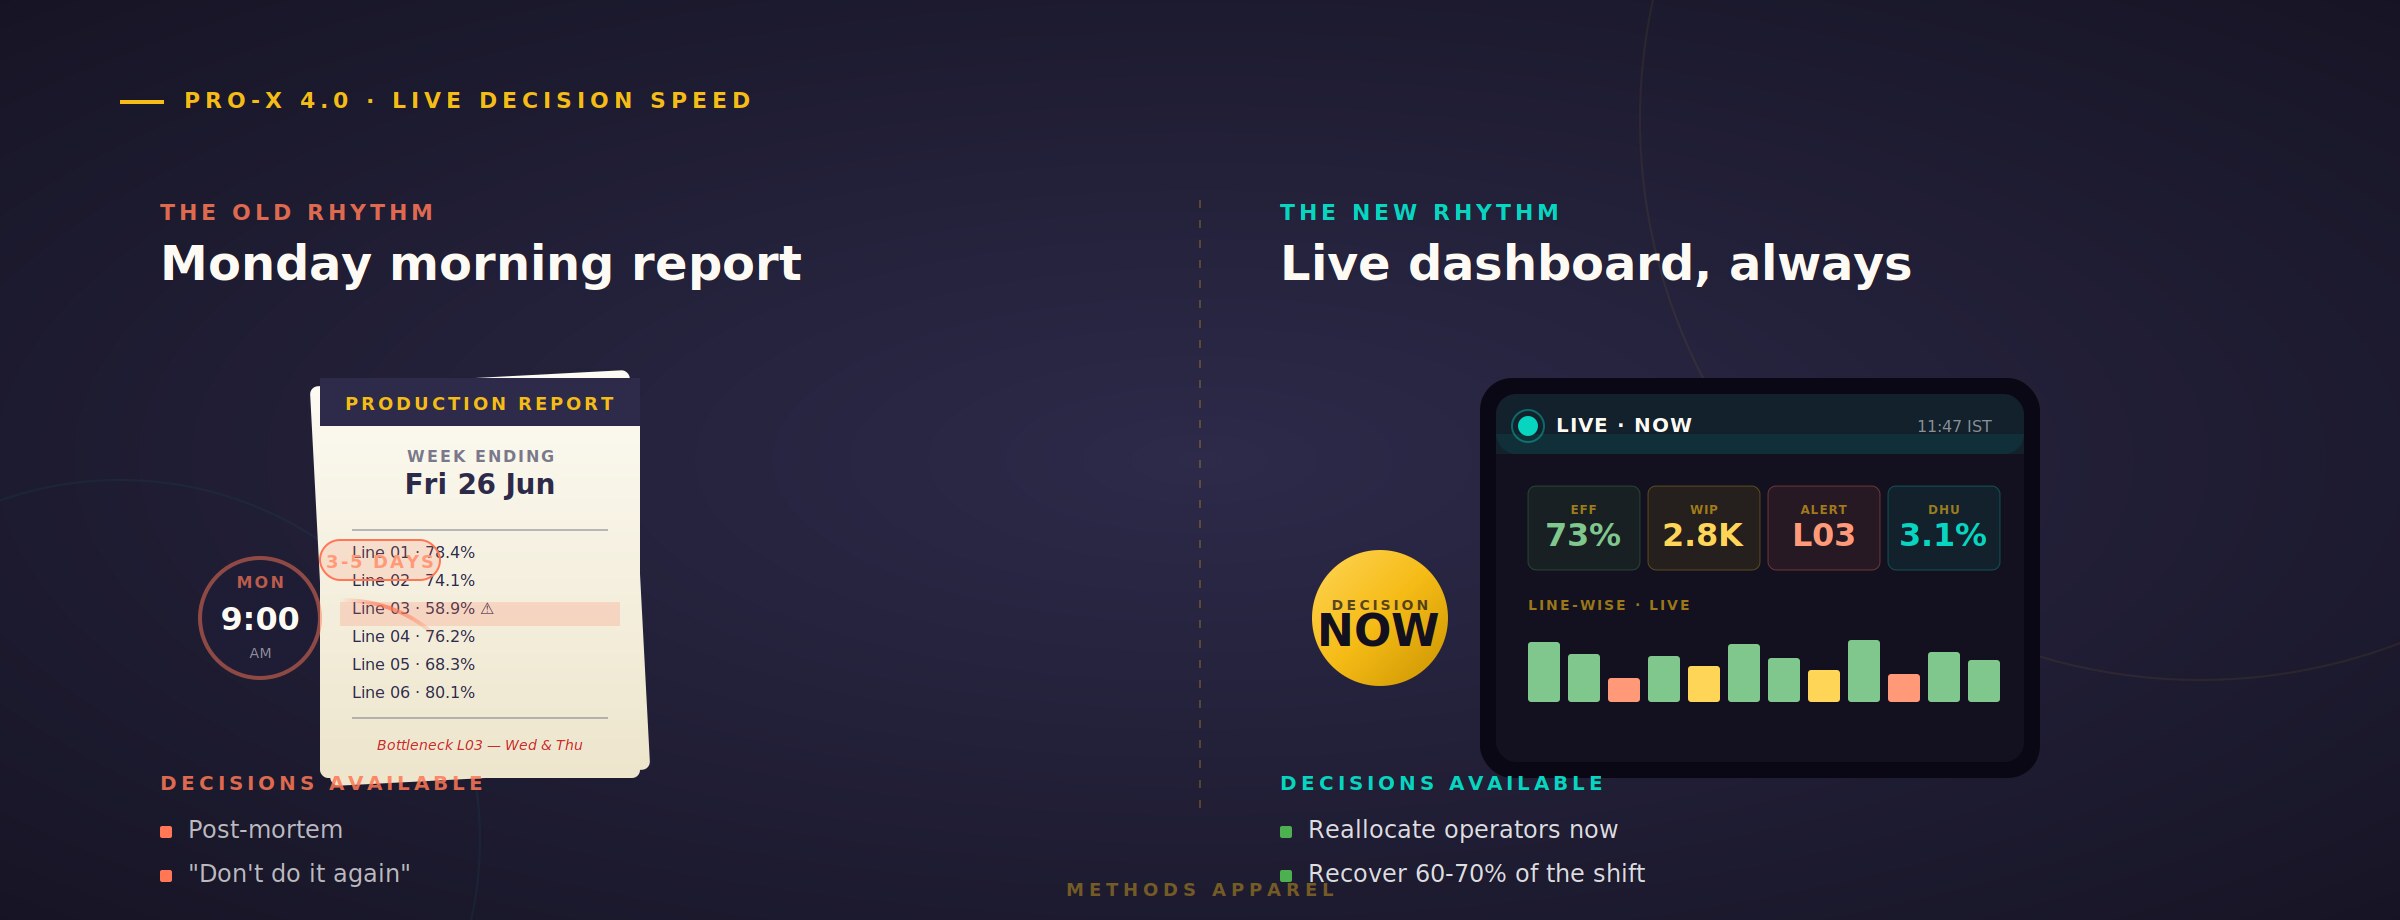
Every apparel factory in South Asia has the same Monday morning ritual. The production report from the previous week lands on the factory manager's desk. Section-wise output. Line efficiencies. Rejection percentages. Delivery status. Twelve pages of numbers, printed on Sunday night, reviewed at Monday's 9 AM meeting.
It is a comforting ritual. It feels like control. It has been the rhythm of factory management for decades.
Here is the problem. By Monday at 9 AM, the events described in that report are already three to five days old. The Friday shift bottleneck that lost 800 pieces is a fixed number now. The Thursday quality problem on Line 07 is finished — and so are the garments that shipped with it. The Wednesday operator absence that dropped efficiency by 12 points on that line? Also done.
Management is not managing the factory. Management is reviewing what happened to a factory that has already moved on.
In our 40+ years across apparel factories in India, Bangladesh, and Sri Lanka, we have watched this pattern evolve — and we have watched a small but growing group of factories abandon it entirely. This article is about why they did, and what changed for them when they did.
The Real Cost of a 3-Day Delay
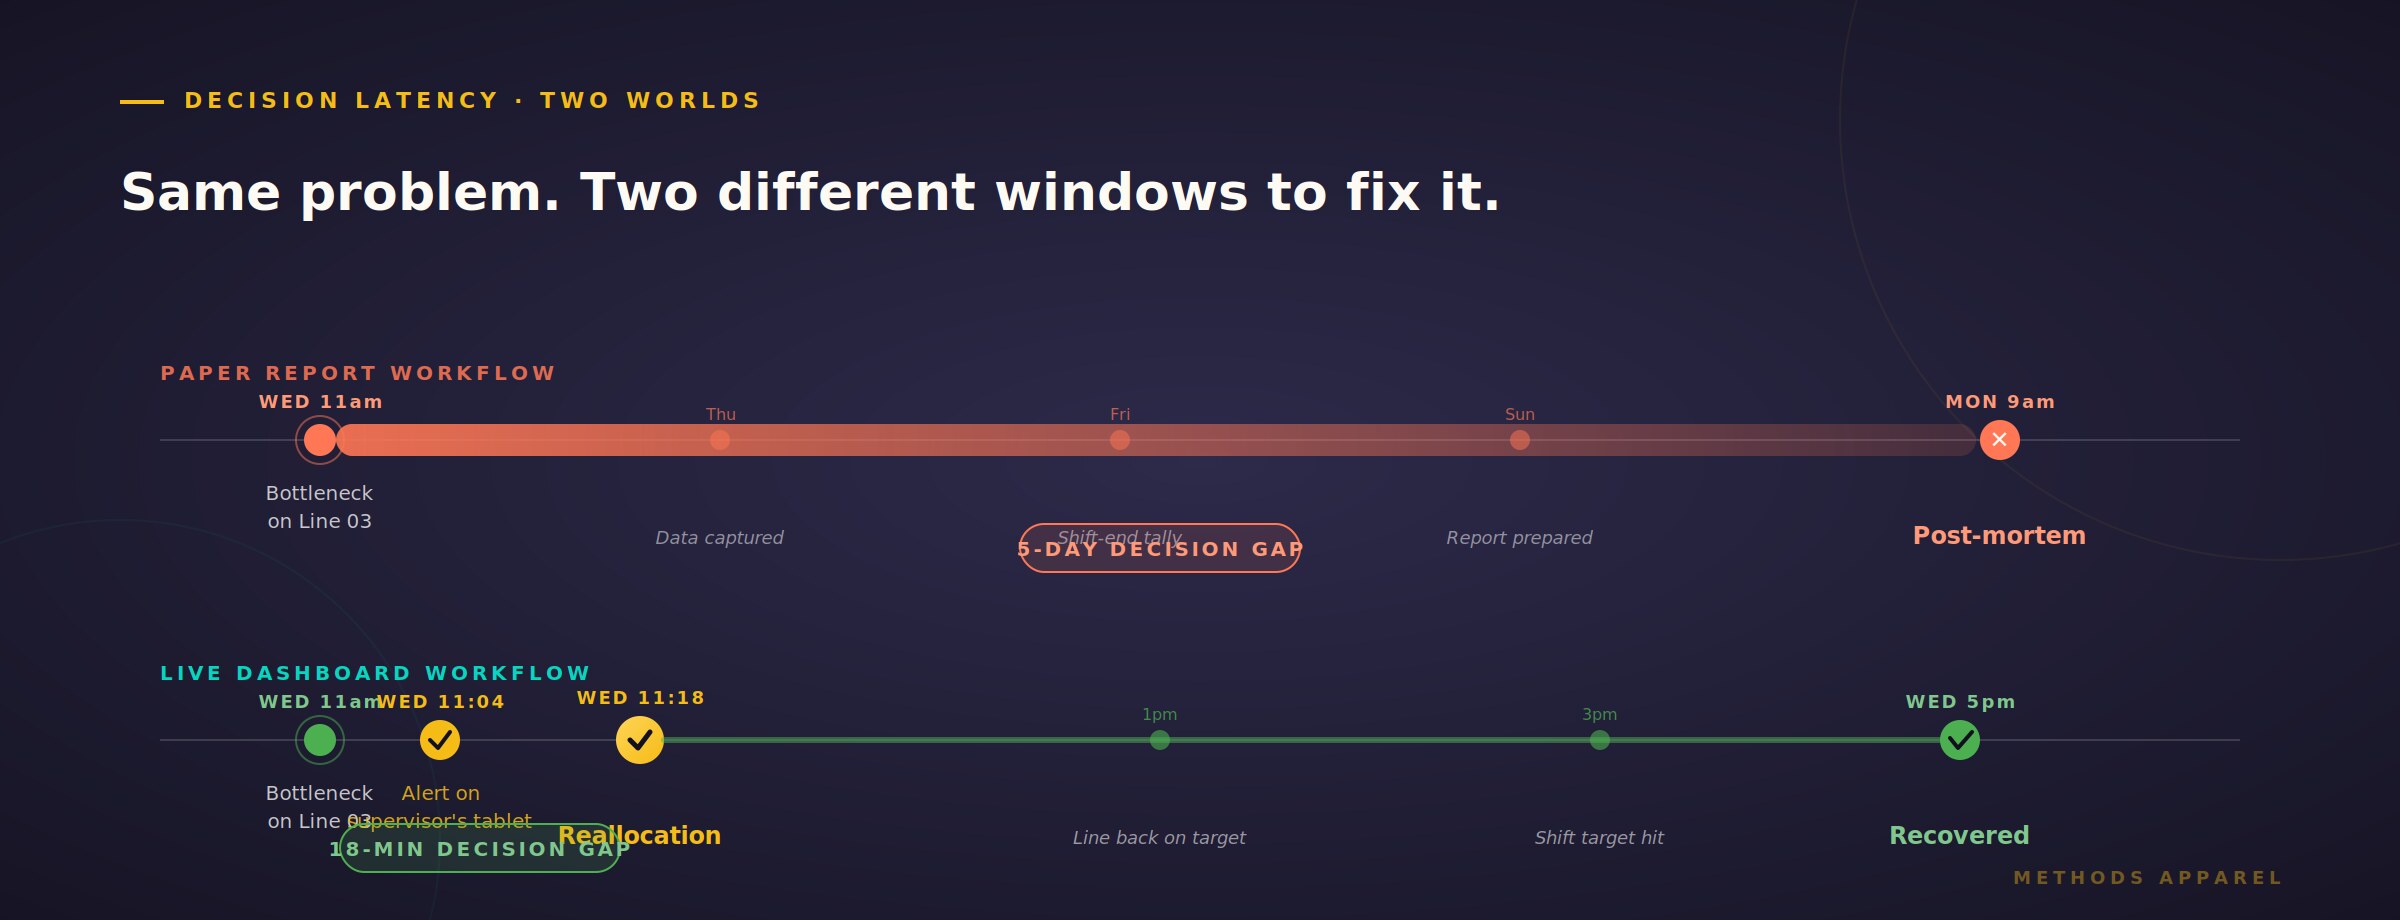
Delay in information doesn't just make decisions late. It changes what decisions are even possible.
When a bottleneck is discovered in real time — say, at 11 AM on Thursday — the supervisor can reallocate operators before lunch, adjust the line balance, and recover most of the day's output. When the same bottleneck is discovered in the Monday report, the only decision available is post-mortem. The output is gone. The delivery is at risk. All that remains is to write down what happened and hope it doesn't happen again.
Real-time information doesn't just make you faster. It gives you access to a different class of decision — the kind that prevents loss instead of accepting it.
Let us make this concrete. For a typical mid-sized apparel factory doing USD 30M in FOB, the compounded cost of delayed-decision management sits in a familiar range:
| Decision That Came Too Late | Typical Frequency | Annual Cost Impact |
|---|---|---|
| Bottleneck reallocation delayed by 6+ hours | 3-5 times per week | USD 90K – 180K in lost output |
| Quality issue caught next day, not on-shift | 1-2 times per week | USD 40K – 90K in re-work / rejections |
| Line imbalance corrected only next morning | Daily on 2-4 lines | USD 60K – 120K in efficiency drag |
| Absence coverage decided too late | 4-8 times per week | USD 30K – 60K in unrecovered capacity |
| Delivery risk escalated after damage done | 2-5 orders per season | Hard to quantify — often largest |
For a USD 30M factory, this compounds to USD 220,000 – 450,000 per year in cost you never see on the P&L, because it is distributed across dozens of decisions no one thinks to add up. Every factory owner we speak to is surprised by the second number, because no one has ever put a total on decision-latency cost.
Why "Faster Reports" Isn't the Answer
The intuitive response to slow information is faster reports. Instead of Monday morning, get the report by Sunday evening. Instead of weekly, get it daily. Instead of daily, get it every shift.
This misses the point.
A report — regardless of how quickly it arrives — is a summary of the past. It aggregates events that have already occurred. It gets read at a specific moment. It informs the next meeting, not the next decision on the floor. Even a shift-end report cannot help a supervisor who needs to make a call in the next 20 minutes about which operator to move to Op 132.
A dashboard is fundamentally different. It is not a summary — it is a live signal. It doesn't get read at a specific moment because it is always being read, by whoever is looking at their tablet or phone or floor display. It shifts management from reviewing past events to reacting to current signals.
What Live Dashboards Change on the Floor
On a floor with live production dashboards — as delivered by Pro-X 4.0 — several routines that used to define factory management simply disappear or transform.
The morning meeting shortens. When everyone in the room already knows the current state of every line, the meeting stops being an information download and becomes a decision meeting. 45-minute meetings collapse to 15 minutes. The extra time returns to actual management work.
Supervisors stop asking, and start acting. When line efficiency is live on a tablet in the supervisor's hand, the question "how are we doing?" is answered in advance. Supervisors spend the freed time walking the floor and coaching operators.
The MD stops waiting. Where the managing director used to check in with the factory manager 2-3 times a day for updates, they now check the dashboard from their office or from a client meeting. The interruption cost across the management chain drops sharply.
Buyer inquiries become instant. When a buyer's sourcing head calls asking "where is my order?", the answer is on-screen in 4 seconds. Not "let me check with the merchant and get back to you tomorrow." The factory becomes an entity that responds in real time — and buyers notice.
The most important thing that changes with live dashboards is the psychological posture of management. You stop feeling like a receiver of news and start feeling like a driver of the operation.
Live at Every Level — Not Just the Top
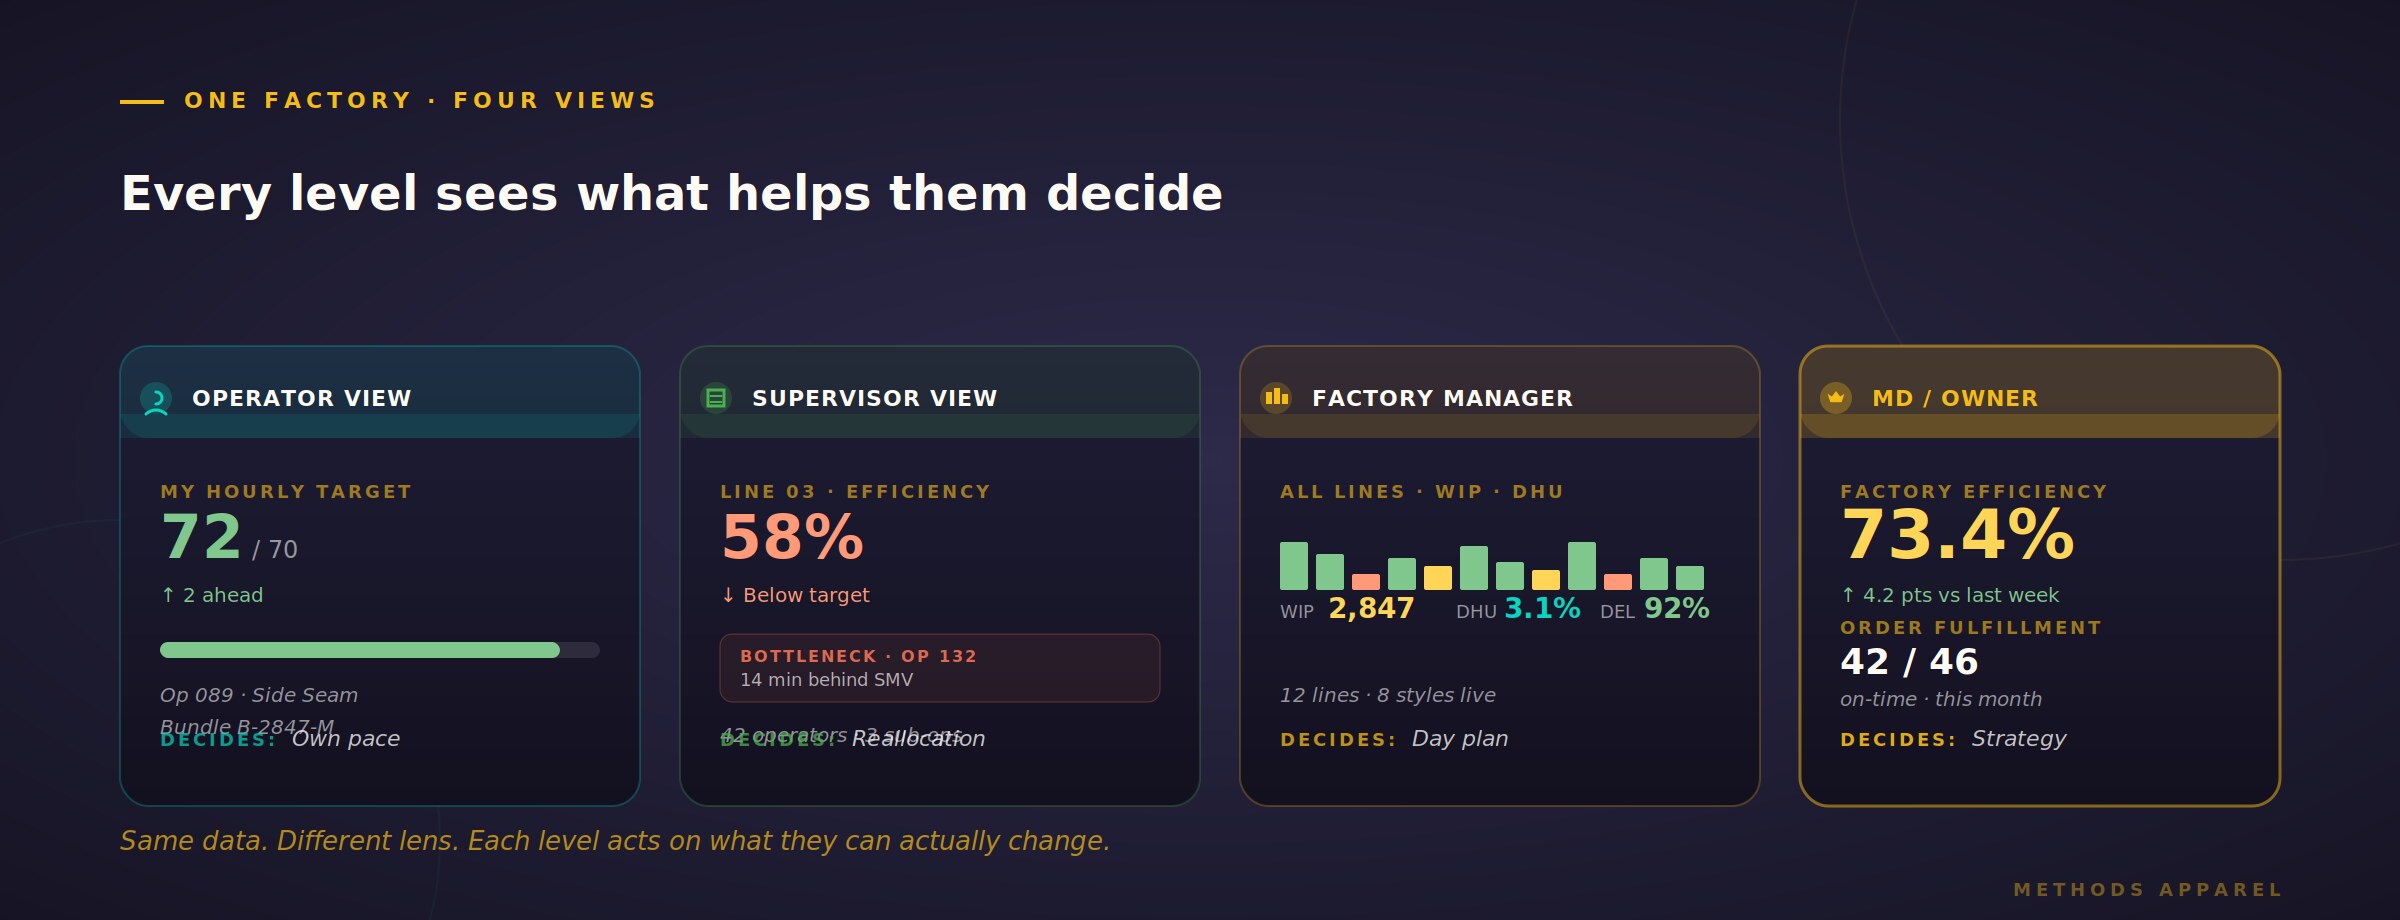
A common misconception is that dashboards are a "management tool" — something for owners and MDs to keep an eye on things. The factories that get the most value from live tracking distribute the dashboard across all four management levels, with each level seeing what it needs.
| Level | What They See | What They Decide |
|---|---|---|
| Operator | Own hourly target vs current output | Own pace, catch-up moments |
| Line supervisor | Line efficiency, bottleneck alerts, operator status | Reallocation, coaching priorities |
| Factory manager | All lines, WIP by section, DHU trend, delivery status | Cross-line rebalancing, day-plan adjustments |
| MD / Owner | Factory efficiency, order fulfillment, buyer visibility | Strategic bets, order acceptance, capacity commitments |
Each level of the organisation gets the view that matches their span of decision. The operator does not see line efficiency (not their decision). The MD does not see operator-by-operator output (not their decision either). Everyone sees exactly what helps them decide well, at the speed the decision needs.
The "Decision Speed" Dividend
Factories that have moved to live dashboards typically report a specific and remarkable pattern within the first 90 days: the cost of a bad shift shrinks by 60-70%.
The reason is straightforward. A bad shift used to be discovered at end of day and absorbed as a loss. Now the bad shift gets identified within 60-90 minutes, corrective action happens on-shift, and most of the loss gets recovered before the shift ends. What used to be a 500-piece deficit becomes a 150-piece deficit. What used to be a 12-hour recovery cycle becomes a 90-minute correction.
Multiplied across every shift, every line, every day of the year, this is where the real productivity gain comes from. Not the dashboard itself. The compounding of small, on-time decisions.
What Implementation Actually Requires
Installing the dashboard software is easy. Getting management to use it as it should be used is the real work.
Two failure modes we see repeatedly:
Passive consumption. Management installs dashboards, glances at them once a day, and continues to make decisions in the old rhythm. Nothing changes. The system runs but delivers 20% of its potential value.
Micromanagement. The opposite failure — management uses the live dashboard to intervene in every small dip, calling supervisors constantly. Supervisors lose autonomy. Operators feel watched. Productivity paradoxically declines.
The middle path is the one that works: predefined thresholds and escalation rules. The system watches; management is called only when specific thresholds are crossed. Between escalations, the floor runs itself and management trusts it to. That trust — supported by the data — is what turns live dashboards from a tool into a management culture.
The Strategic Reason This Matters Now
Five years ago, live dashboards were a nice-to-have. Today they are becoming a differentiator in how buyers choose between factories.
Major buyers — Zara, H&M, Marks & Spencer, Target, Walmart, Levi's — are actively assessing the "digital maturity" of their sourcing partners. A factory that can share real-time order visibility, live production status, and shift-level quality data is one that buyers want to grow with. A factory whose latest data is last Monday's PDF is one that gets moved to lower-margin, more replaceable programs.
This is not a future scenario. It is happening now, quietly, on every buyer's supplier scorecard. Factories that build live-dashboard capability today are compounding an advantage. Factories that don't are compounding a disadvantage.
The gap between report-driven factories and dashboard-driven factories is not visible from the outside. But it shows up sharply in which factories keep winning the best orders.
How Pro-X 4.0 Delivers Live Dashboards
Pro-X 4.0, our flagship cut-to-pack production tracking platform, includes a live dashboarding layer designed for exactly the four management levels described above. Operators see their own targets. Supervisors see line-level efficiency and bottleneck alerts. Factory managers see multi-line and section views. MDs and owners see factory-wide KPIs and per-order status — accessible from any device, refreshed every 60 seconds.
Beyond the technology, Pro-X 4.0 deployments come with what most software vendors do not offer: on-the-ground management adaptation support. Our team spends 30-60 days with the factory not just implementing the software, but helping supervisors and managers learn the rhythm of live-signal management. This is where the ROI actually gets earned.