Walk into any well-run cutting room in South Asia and it will look impressive. Spreader operating smoothly. Layers stacked cleanly. Cutters moving efficiently between lays. The daily cutting report at end of shift will show respectable numbers — pieces cut on plan, marker efficiencies within target, lays completed on time.
Now walk into that same cutting room with a stopwatch, a fabric scale, and a ply-counter. Measure three things over one week: actual marker efficiency, actual ply count per lay, and actual lay-completion time. Then compare to what the reports say.
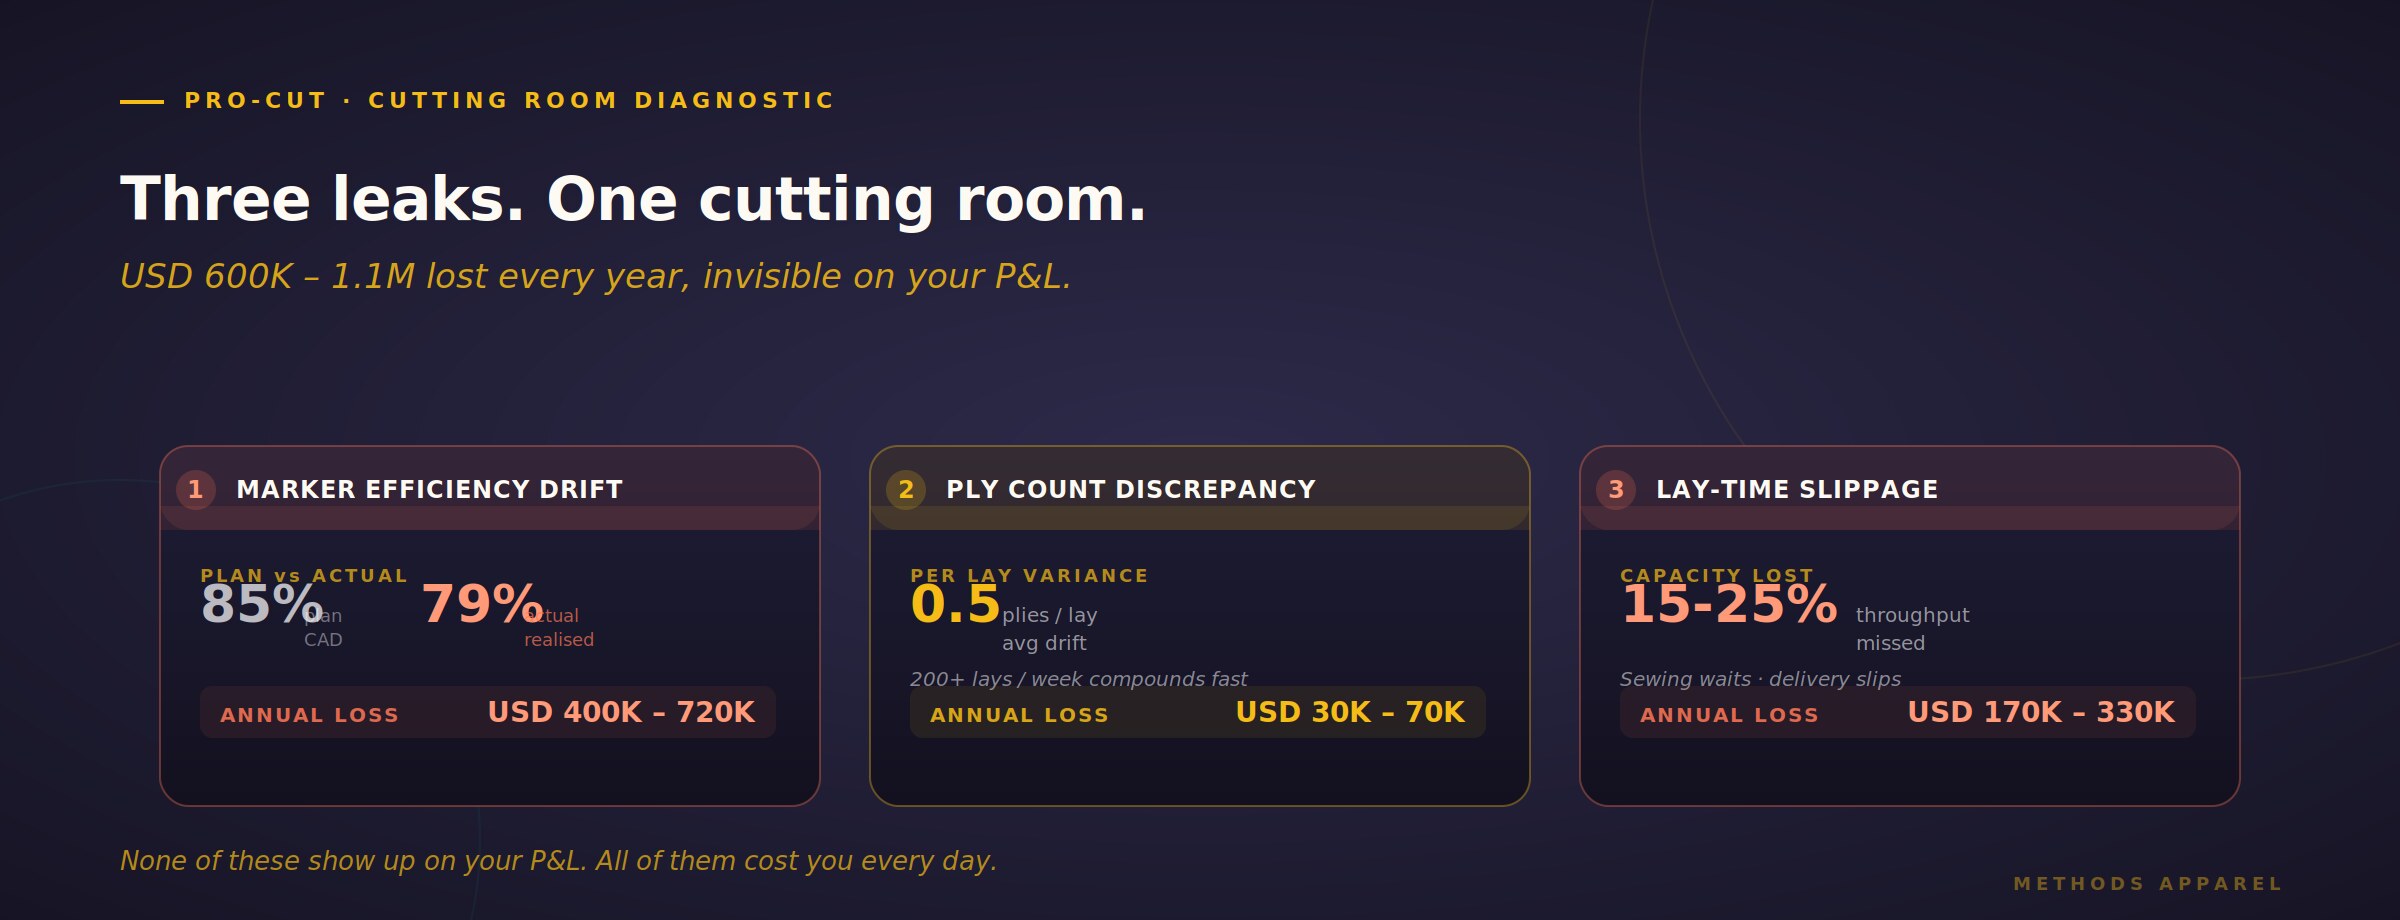
Almost every time we do this exercise with a client factory, we find the same pattern: the cutting room is leaking 4-6% of its fabric cost, 8-15% of its capacity, and nobody knew it was happening.
In our 40+ years in apparel manufacturing, we have watched this quiet leak play out across factories large and small. The problem is not incompetence. The problem is that the reports were designed for a slower era, when the plan and the reality moved together. Today they don't — and the gap between them is where the money goes.
What Your Cutting Report Actually Measures
The standard end-of-shift cutting report contains a familiar set of numbers:
Each of these numbers is technically true. The lays did complete. The pieces did get cut. The marker file did show 85%. The trouble is not with what the reports say. The trouble is with what they silently assume — that the plan and the reality are the same thing.
They are not. And the gap between them lives in three specific places.
Loss #1 — Marker Efficiency Drift
Your CAD system generates a marker with, say, 85% efficiency. That number goes into the plan, into the costing sheet, into the fabric consumption calculation. Everything assumes 85%.
Then reality happens. The spreader operator finds a fabric flaw and drops the ply. The end-loss on each lay adds up. A shade batch changes mid-lay and requires a fresh start. A short-piece section gets its own micro-marker at 74% efficiency. The bottom sheets of the spread have edge wastage the marker didn't anticipate.
By the end of the week, the average realised efficiency across all lays is not 85%. It is typically 79-81%. On a fabric-heavy style, that 4-6 point drift represents real fabric that got cut and thrown away. Nobody logged it. The costing sheet still says 85%.
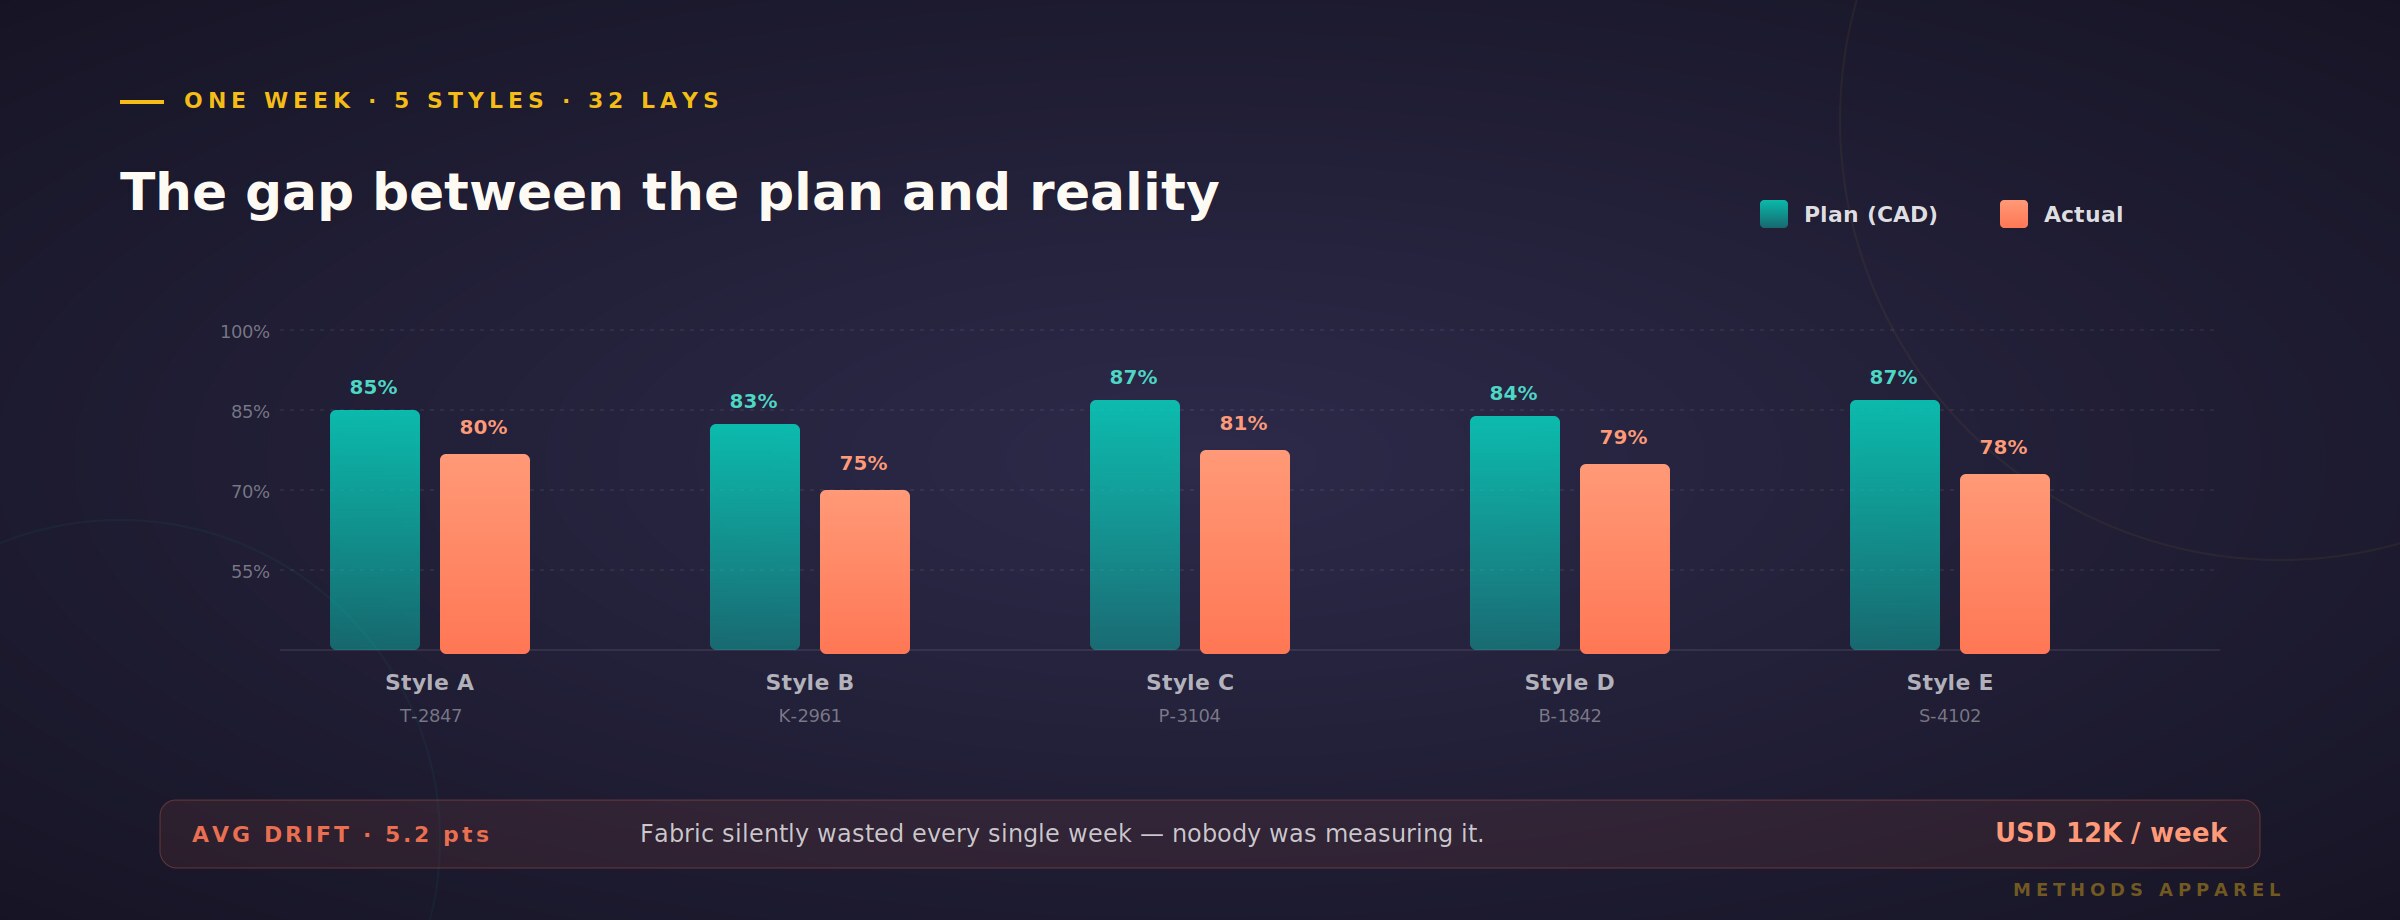
A 4-percentage-point drift on marker efficiency, on a factory consuming USD 18 million of fabric a year, is USD 720,000 in silent fabric loss. Every year. And no report you have surfaces it.
Loss #2 — Ply Count Discrepancy
The lay plan says 120 plies. The lay was cut. The bundle tickets get printed off 120 plies. Everyone moves on.
But if the spreader actually laid down 118 plies — because two got dropped for defects and the operator didn't update the plan — the sewing floor will short-ship on that style by 2 pieces per size ratio, discovered only at packing. If 122 plies were laid (an over-count that no one noticed) the factory paid for fabric that will never turn into revenue.
Across a factory doing 150-250 lays per week, a systematic 0.3-0.8 ply variance per lay adds up to USD 30,000 – 70,000 annually in unaccounted fabric on a mid-size operation. Larger factories, more. The individual number per lay looks trivial. That is exactly why it never gets flagged.
Loss #3 — Lay-Time Slippage
The plan says: 8 lays per shift, 45 minutes per lay average. Total: 6 hours of table time, comfortable buffer for meals and setups.
The reality: the first lay takes 62 minutes because the fabric took time to load. The third lay hits a shade break and adds 20 minutes. The seventh lay's marker won't load properly and eats 15 minutes on the CAM. By end of shift, only 6 lays completed — meaning 25% less throughput than plan. The cutting room becomes the constraint on the whole factory, and nobody notices until sewing runs out of bundles the next morning.
The report at end of shift will faithfully record: "6 lays completed." It will not tell you that 8 were planned, and it will certainly not tell you why the difference happened.
Adding It Up on a USD 30M Factory
Let us put realistic ranges to these three losses for a mid-size apparel operation:
| Hidden Loss | Typical Range | Annual Cost Impact |
|---|---|---|
| Marker efficiency drift | 4-6 pts below plan | USD 400K – 720K in fabric |
| Ply count discrepancy | 0.3-0.8 plies/lay variance | USD 30K – 70K in fabric |
| Lay-time slippage | 15-25% throughput loss | USD 90K – 180K in capacity |
| Downstream sewing wait | 2-4 hrs/week per line | USD 80K – 150K in efficiency |
Total range: USD 600,000 – 1,120,000 per year for a USD 30M factory. Most of it invisible on the P&L because it is distributed across a thousand small events, none of which is large enough to investigate individually.
The cutting room is not a cost centre. It is a silent margin compressor. You do not see the loss because it never shows up as a line item — it just makes every other line item smaller.
What Actually Fixes This
The cutting room reports need to change from end-of-shift summaries to lay-level real-time capture. Instead of one report per shift that averages everything, the system needs to record what actually happened at each of the 150-250 lays per week:
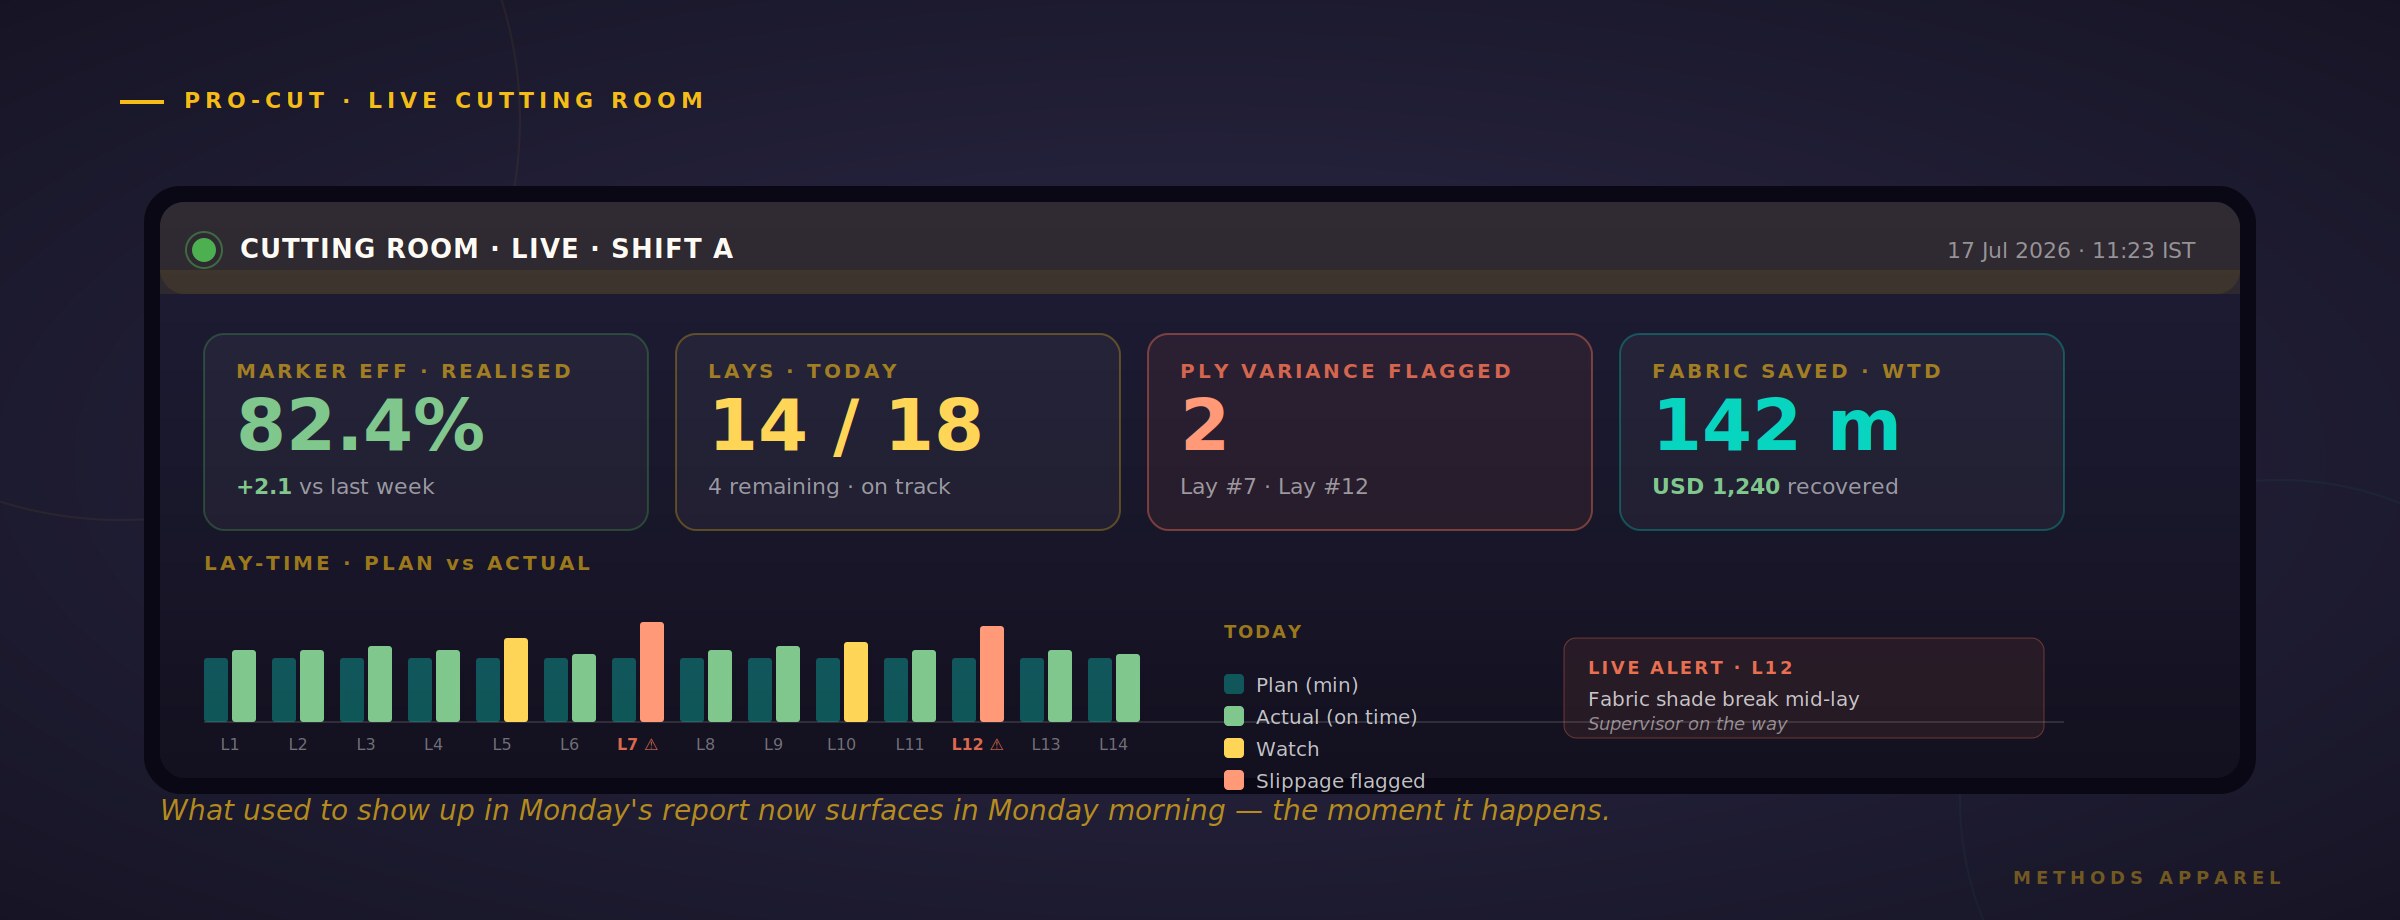
With this data captured — automatically, at the moment each event happens, not at end of shift — the cutting manager can see leaks the day they occur, not the month after they have compounded. IE can drill into which markers systematically underperform. Costing can update fabric consumption assumptions based on real data instead of hopeful CAD values.
What Changes in the First 60 Days
Factories that move from paper cutting reports to lay-level real-time capture — with the discipline to actually act on the data — typically see:
| Before | After Real-Time Cutting Capture |
|---|---|
| Marker realised efficiency 79-81% | Recovers 2-3 pts within 60 days |
| Ply count discrepancy 0.5+ / lay | Under 0.1 / lay — reconciled at spread |
| Lay-time slippage 15-25% | Slippage under 5% within a quarter |
| Bottleneck discovered end-of-shift | Bottleneck flagged within the lay |
| Costing based on CAD marker % | Costing based on realised marker % |
Total year-one recovery on a USD 30M factory typically lands in the USD 350,000 – 600,000 range. Which is roughly 55-65% of the original hidden losses. The remainder comes in years two and three as the practice matures and the data accumulates enough history to inform pattern-level decisions (marker library optimisation, spreader operator coaching, style-mix rebalancing).
How Pro-Cut Delivers This
Pro-Cut, our dedicated cutting room management system, was built specifically to close the gap between the cutting plan and cutting reality. It captures lay-level data at the moment each event happens — spread start, ply count validated at the spreader, cut start, cut complete — and feeds it into a live dashboard that surfaces drift the same day it occurs.
It integrates with Pro-X 4.0 to bind cut-piece output to downstream bundle tracking, meaning end-loss and short-piece events are reconciled at source rather than surfacing as mysterious shortfalls at packing. It also feeds Pro-SMV so that costing and IE use realised efficiency numbers, not planned ones, when quoting new business.