Every quarter, in every apparel factory of any size, the same conversation happens. The finance team closes the books, the actuals don't quite match the plan, and someone says a version of "we need to look at our costing more carefully". Then everyone gets busy again and nothing changes until the next quarter, when the same conversation happens.
Here is what is actually going on. The costing sheet used to quote every one of those styles was systematically optimistic in the same three places, style after style, quarter after quarter. It was not an error. It was not incompetence. It was the honest output of a model built on numbers that had already stopped being true.
In our 40+ years across apparel factories in India, Bangladesh, and Sri Lanka, we have seen this pattern often enough to be direct about where it lives. The gap between the costing sheet and the P&L is not random. It is three specific lies, each measurable, and each fixable — but only if the factory closes the loop between production actuals and the costing model.
The Costing Sheet as a Story We Tell Ourselves
A costing sheet is a forecast dressed up as a calculation. It takes three inputs — fabric consumption, labour minutes, and overhead absorption — multiplies them by unit prices, and produces a "cost per garment" that the merchant then negotiates against. It looks precise. It reads as authoritative. Buyers accept it. Everyone signs.
But every one of those three inputs is a planned number, not a realised one. The fabric consumption is calculated at the marker's planned efficiency. The labour minutes are calculated at the SMV database's stored value. The overhead absorption is calculated at last year's volume assumption. All three are somewhere between six months and eighteen months out of date, and all three drift in the same direction — the direction that flatters the costing.
The costing sheet is not wrong on purpose. It is wrong because it was built once, correctly, and then never updated when reality drifted. Every quote you send out uses the version of your factory that existed 12 months ago, not the one operating today.
Lie #1 — The Marker Efficiency Is Not What the CAD File Says
Your costing sheet uses the marker efficiency from the CAD file — typically 85% for a moderately complex garment. That number feeds directly into fabric consumption: garment weight × (1 / marker efficiency) × fabric price.
Reality, as we documented in detail in our cutting room hidden losses article three weeks ago, is that realised marker efficiency across a week of production is typically 79-81%. Bottom-of-lay wastage, shade breaks, short-piece markers, and end-loss all compound to shave 4-6 points off the plan.
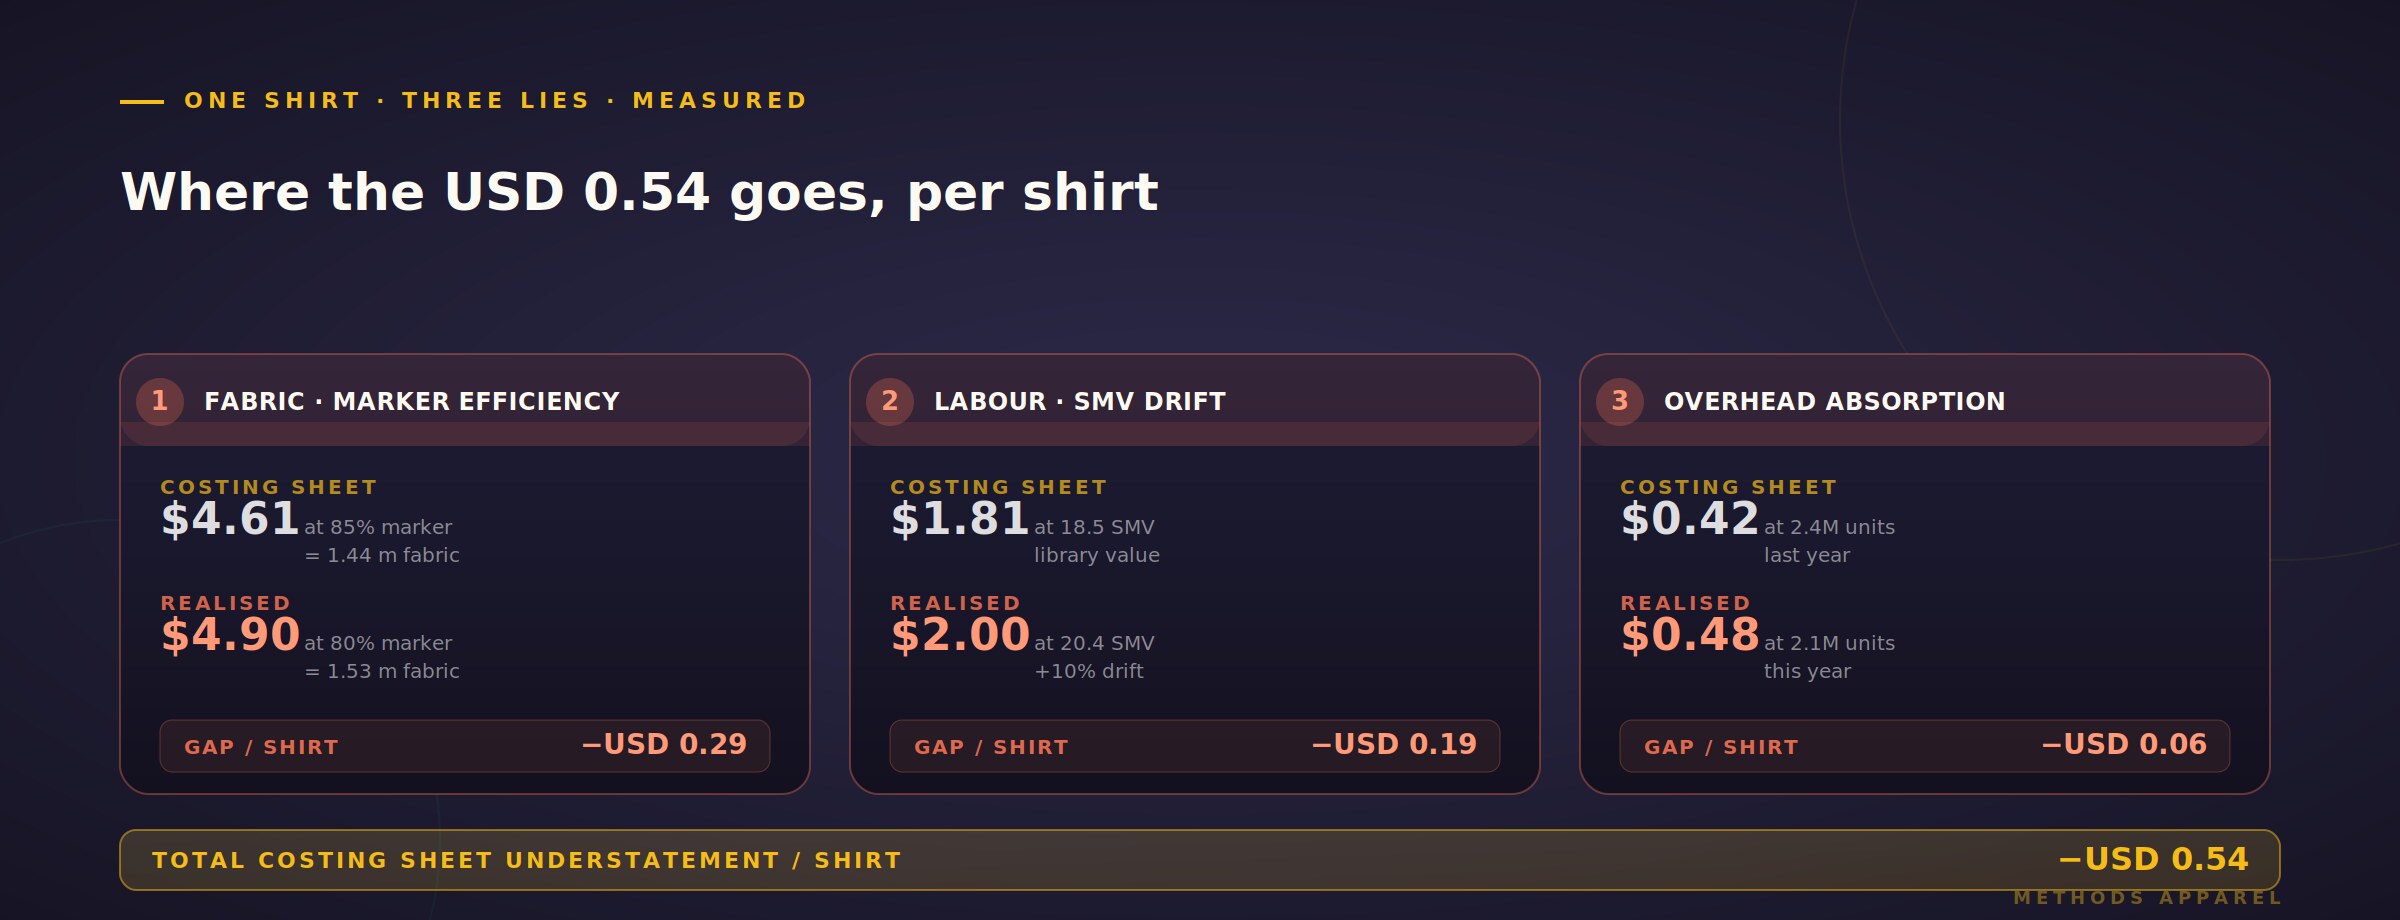
What that means on the costing sheet: if you costed a shirt at 1.44 metres of fabric using a planned 85% marker efficiency, and your realised efficiency is 80%, the actual fabric consumption is closer to 1.53 metres. Multiply by fabric price of USD 3.20 per metre, and you have USD 0.29 per shirt that never entered the quote. On 240,000 shirts a quarter, that is USD 69,600 that leaks straight out of margin.
Lie #2 — The SMV Was Right Twelve Months Ago
Your costing sheet pulls SMV from your standard library. That library was accurate when it was built — probably during a serious IE exercise 12-24 months back. Since then, the machines have changed, the operator mix has changed, the fabric weights have changed, and the sub-assembly sequences have quietly evolved. But the SMV in the library has not.
We covered the mechanism of this drift in detail in our Why Your SMVs Are Wrong by Friday piece back in May. The relevant number for costing: on styles that have been produced multiple times over 12+ months, the actual SMV typically differs from the library SMV by 8-12% in the direction of higher time.
Applied to costing: a shirt costed at 18.5 SMV, at a CM rate of USD 0.098 per minute, quotes at USD 1.81 in labour. If the realised SMV is 20.4 minutes (10% higher), the true labour cost is USD 2.00. That is USD 0.19 per shirt unquoted — another USD 45,600 per quarter on 240,000 shirts.
Lie #3 — The Overhead Absorption Assumes Last Year's Volume
Your overhead absorption rate — the number the costing sheet uses to allocate factory overhead to each garment — was calibrated for a specific annual volume. If your factory did 2.4 million units last year, and this year's actual volume is 2.1 million units, the overhead absorption rate should have gone up by 14% when the volume dropped. It rarely does, because overhead absorption is treated as a "set once a year" calculation.
The effect on costing is direct. If the sheet allocates USD 0.42 of overhead per garment based on the old volume, but the actual per-garment overhead at current volume is USD 0.48, every garment quotes at USD 0.06 below its true fully-loaded cost. On 960,000 units a year, that is USD 57,600 in undercosted overhead absorption flowing straight to the P&L as reduced margin.
This is the hardest of the three lies for factories to catch, because it looks like an accounting issue rather than an operational one. Finance owns it. Merchants live with it. The two departments rarely have the conversation that would fix it.
The Three Lies Add Up
Individually, none of the three margins looks catastrophic. Combined, they explain a very specific pattern that most owner-operators recognise from their own numbers:
| Cost Component | Costing Sheet | Realised | Gap per Shirt |
|---|---|---|---|
| Fabric (marker eff) | USD 4.61 (85%) | USD 4.90 (80%) | USD 0.29 |
| Labour (SMV) | USD 1.81 (18.5 SMV) | USD 2.00 (20.4 SMV) | USD 0.19 |
| Overhead absorption | USD 0.42 | USD 0.48 | USD 0.06 |
| Total cost | USD 6.84 | USD 7.38 | USD 0.54 |
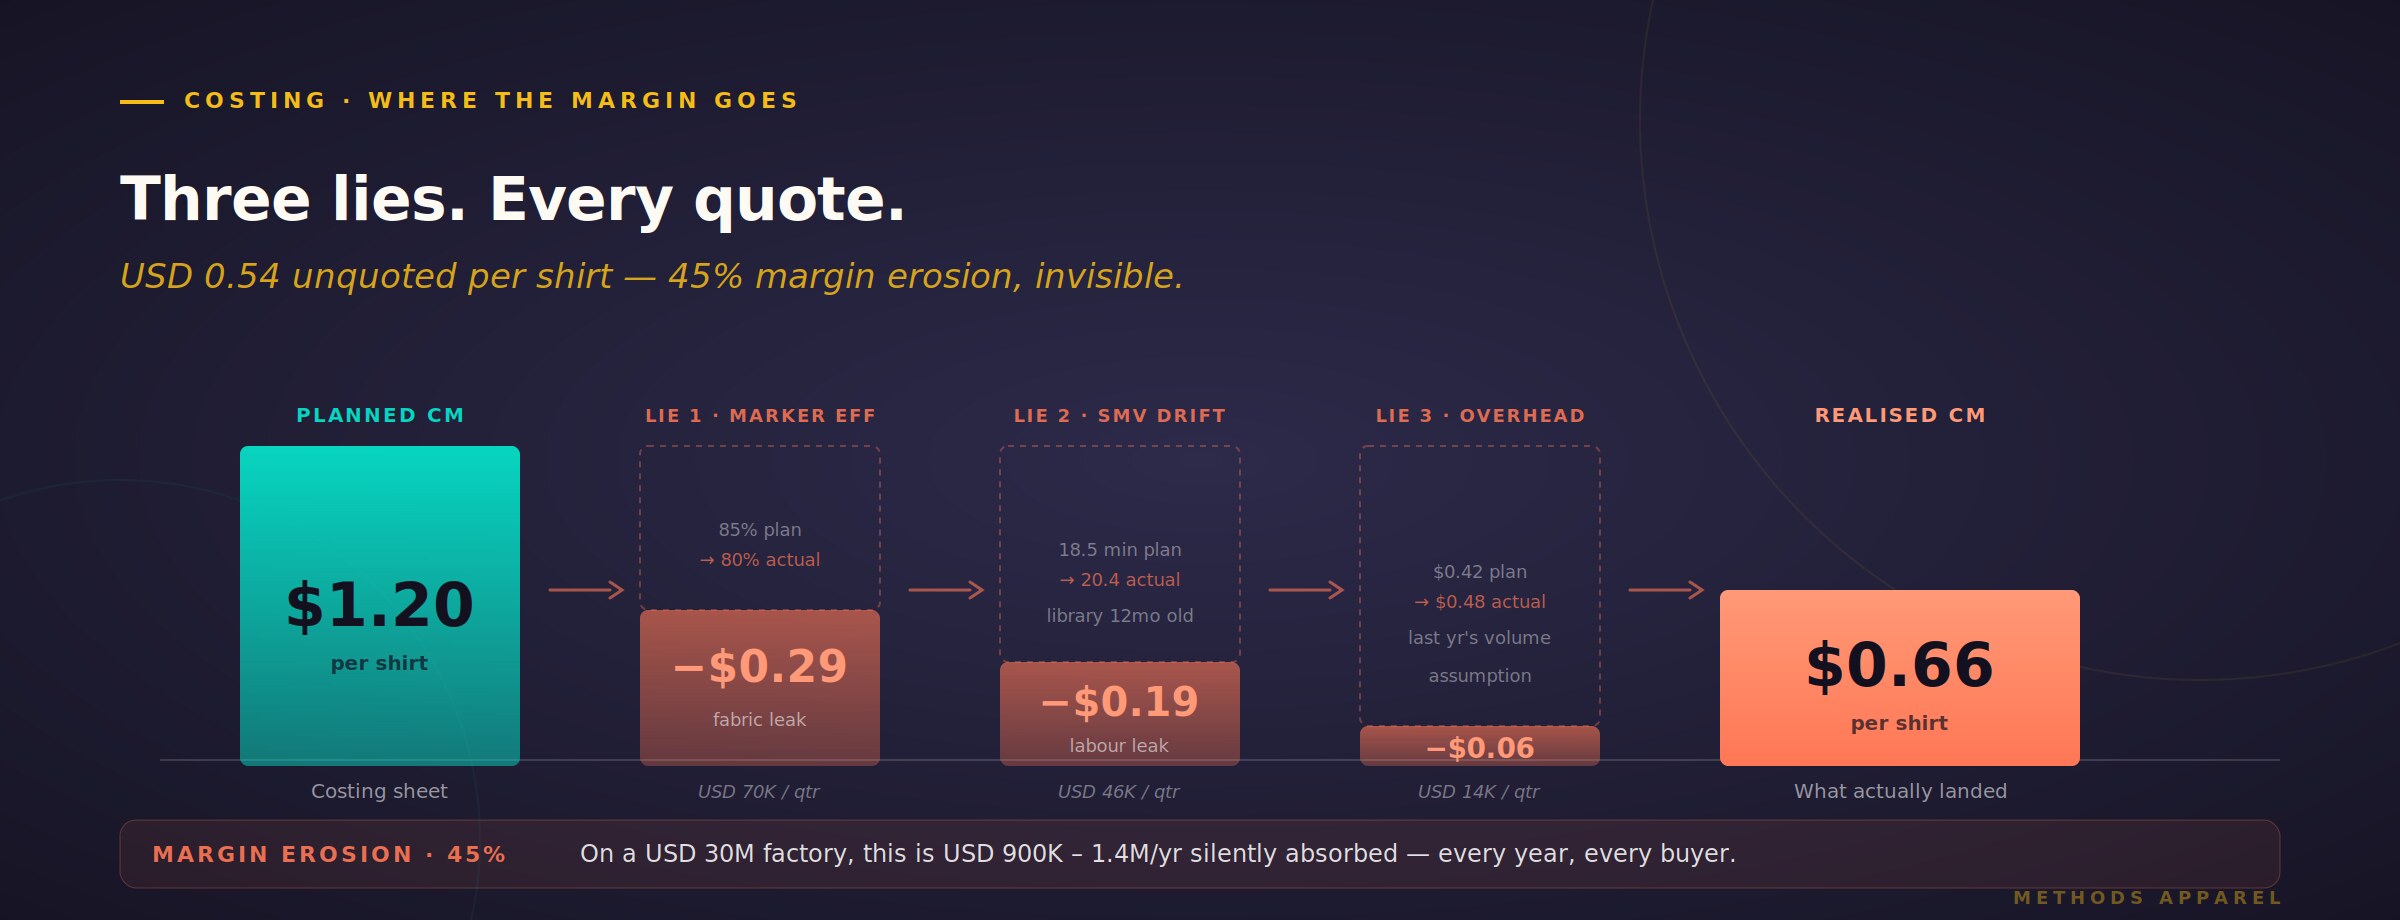
At a costing margin of USD 1.20 above cost — target CM per shirt — the realised margin lands at USD 0.66. That is 45% margin erosion against the costing plan, on the same shirt, going through the same factory, quoted at the price the buyer signed off on.
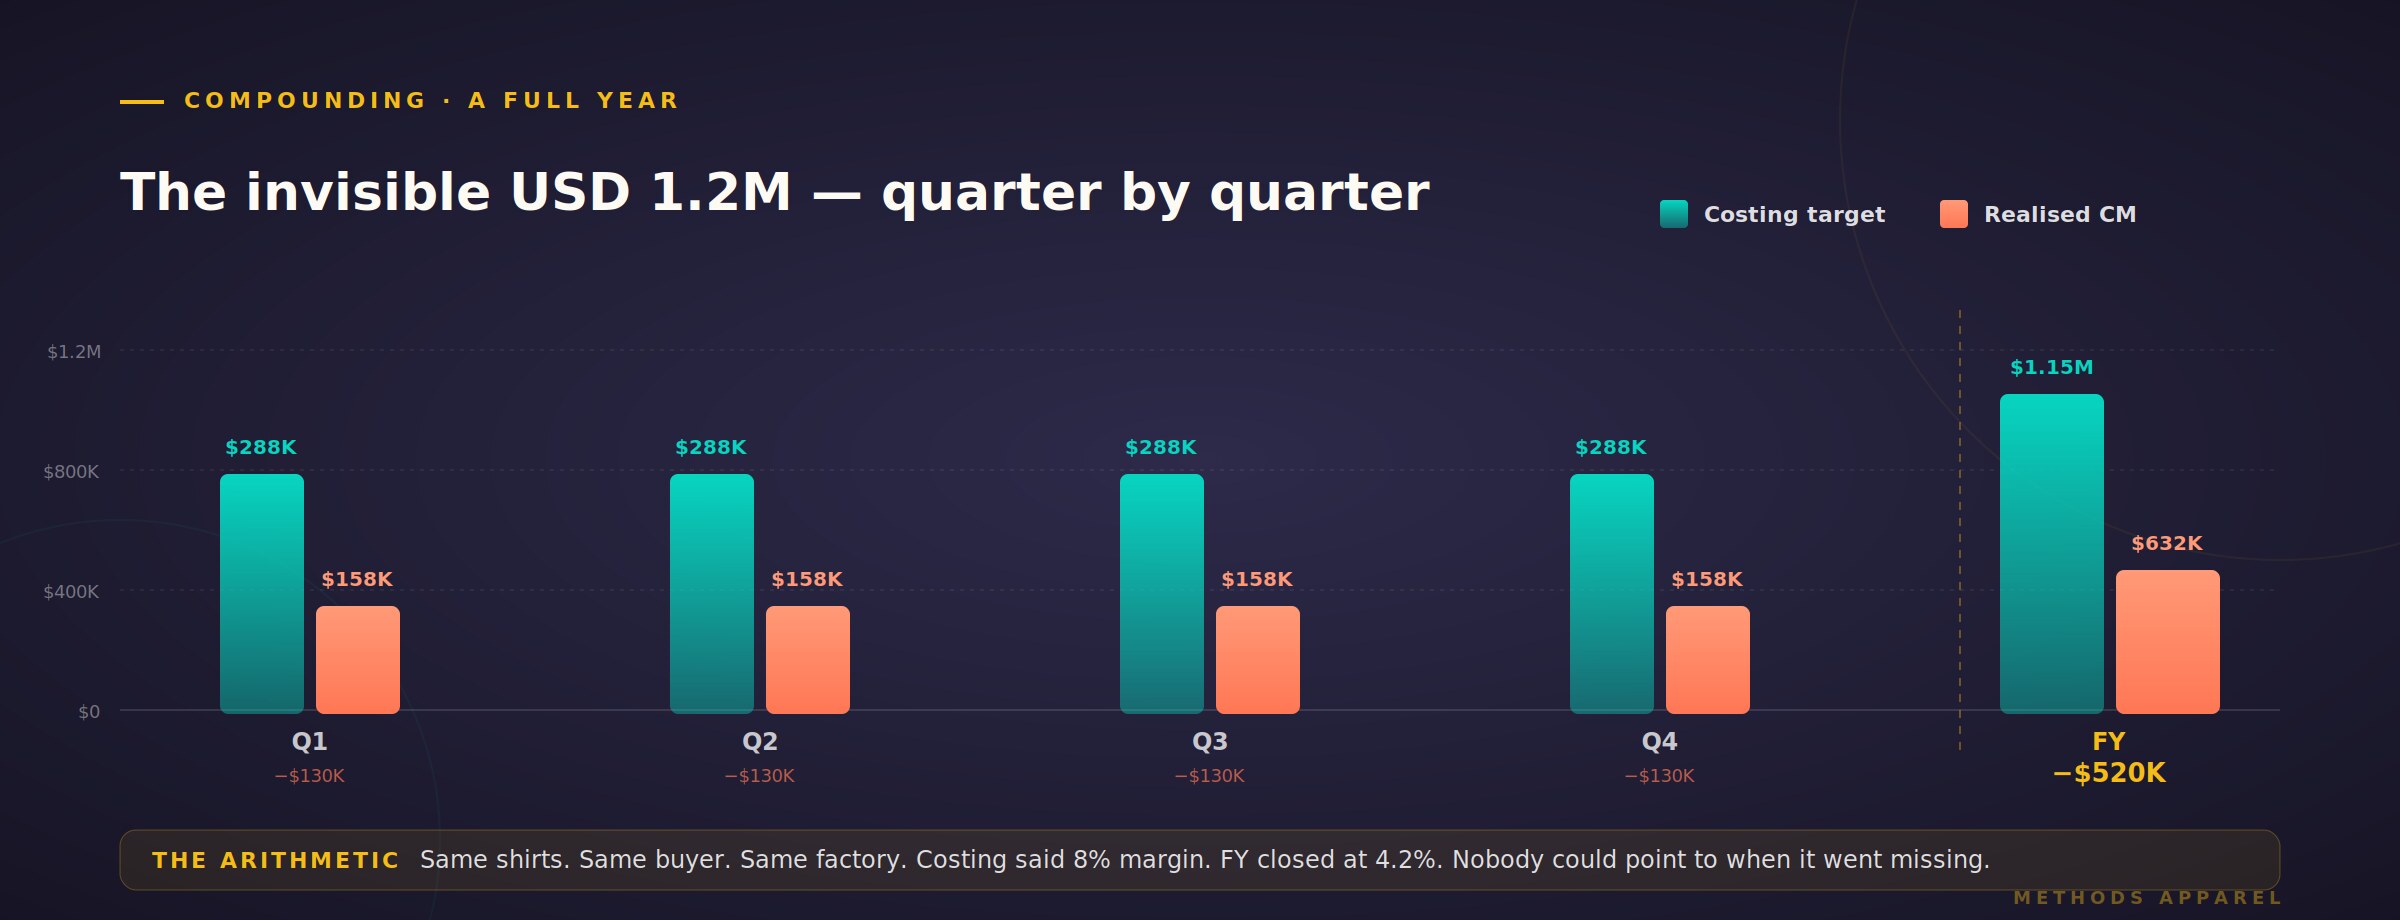
On a factory doing USD 30 million in annual revenue at an average of 6.8% net margin, this compression works out to roughly USD 900,000 – 1,400,000 per year in margin quietly absorbed. It doesn't show up as a single event. It shows up as "we should have made 8% and we made 4%" at the end of every fiscal year.
Why This Compounds at Buyer Negotiation
There is a second-order effect worth being direct about. Because the costing sheet consistently underquotes the true cost, the factory consistently accepts prices that leave less real margin than it thinks. Over time, buyers learn — implicitly, through the negotiation pattern — that your floor price is lower than it should be.
By the third or fourth season with the same buyer, the negotiation dynamic is anchored on a false baseline. The buyer is asking for reductions from a price that was already 6-8% below your true cost. Even a modest concession compresses margin further. Even holding firm doesn't recover what was structurally missed.
The fix cannot come from the merchant. The merchant is negotiating against a costing sheet whose inputs they didn't produce and can't validate in real time. The fix has to come from closing the loop upstream — making sure the costing sheet uses realised marker efficiencies, realised SMVs, and current-year overhead rates.
What Closing the Loop Looks Like
A factory that has systematically closed the loop between production actuals and the costing model has a specific set of practices. None of them is expensive. All of them require organisational discipline that most factories don't have.
| Practice | What It Looks Like |
|---|---|
| Rolling marker efficiency | Monthly average of realised marker efficiency by style category feeds costing, not CAD file value |
| Living SMV library | Every produced style has its SMV updated based on actual production data within 90 days |
| Quarterly overhead reset | Overhead absorption rate recalculated every quarter using trailing-3-month volume, not annual budget |
| Costing sign-off | IE and finance both sign off on the costing inputs before merchant quotes; not just merchant approval |
| Actuals feedback | Monthly review of costing vs realised on top 20% of styles; adjustments feed back into the library |
| Buyer segment view | Costing accuracy tracked by buyer segment; systematic under-cost patterns flagged and corrected |
The organisational challenge is not implementing these practices. It is giving finance and IE joint authority over the costing model, which cuts across the traditional department lines in most apparel groups. That is why most factories know these practices exist but haven't adopted them — the fix is political, not technical.
The costing sheet is the most important document in your factory that nobody has clear ownership of. Merchants use it. Finance validates it. IE feeds it. Nobody owns the accuracy of it. That is where the money goes.
How Pro-SMV Helps Close the Loop
Pro-SMV is not a costing tool. But it is the foundation the costing tool needs, because it produces the two inputs that drift furthest and hurt margin most — accurate current SMV and realised marker efficiency at the style level.
By running Pro-SMV against your actual production, the SMV library becomes a living document rather than a historical artefact. New styles get their SMV set from real data within days of first production. Existing styles get updated automatically as production patterns shift. And realised marker efficiency by style category becomes a queryable number rather than a rumor.
What the costing team then does with those inputs is up to them — Pro-SMV doesn't replace the costing sheet. But it removes the most systematic sources of costing optimism, which is where 70-80% of the margin erosion lives.